 All data is not created equal.
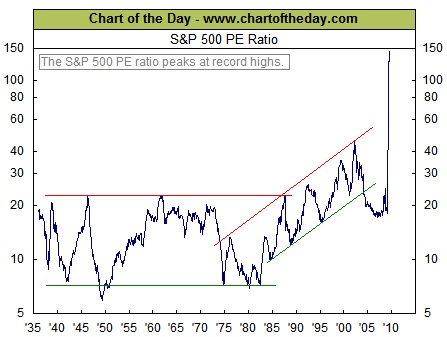
This chart from Chart of the Day would seem to indicate that US stocks are more expensive and overvalued then they’ve ever been.
The rest of the story is that the last 12 months of earnings are not representative of what earnings will be going forward. Our best estimate is that at current price levels, the PE ratio is actually around 13 to 17. Most definitely not the most expensive market in history.
Much of our research effort involves separating good data from bad data, which is essential to gain and maintain a competitive edge against other investors. Looking at recent trends in an uncommon environment could mean you are extrapolating errant future trends. This is when knowing what to ignore and knowing what to value becomes imperative. The next step is to determine how much time you have to spend hashing this out.
Most agree this type of analysis needs to be done with your investments. If you reach a point, where you no longer have the time, then hire it out. Delegation becomes more and more important when your responsibilities increase in other areas.
The lesson here is to focus on what you can control and be disciplined to know what to ignore otherwise.


