Many investors have been tempted to invest more, if not all, of their portfolios in the S&P 500 given the incredible run it’s had over the last decade.
But today we are talking through five reasons why you should consider not making a concentrated investment only in the S&P 500.
Do You Let Recency Bias Impact Your Investment Decisions?
When investing, we are often swayed by recency bias. If something has been doing well lately our instincts lead us to believe it will continue to do well.
Past performance ends up being the dominant factor influencing our investment decisions. However, past performance is not an indicator of future results.
For example, if the S&P 500 has been growing 15% per year why would you want to also invest in an area that has only returned 8%?
It is easy to have a narrow focus or choose to only see the positive aspects when making investment decisions but it is important to understand the big picture.
What Is the S&P 500?
When many think of investing, they think of companies in the S&P 500 like Apple, Amazon, or Microsoft. Launched in 1957, the S&P 500 includes around 500 of the largest domestically-based companies in the United States and has a market cap weighting, which means the largest company (Microsoft currently) will have the largest share of the index (~7%) vs. one of the smallest (Ralph Lauren at 0.01%).
While the S&P is technically an index, there is still an “investment committee” that actively decides which new companies are added and removed each year.
For example, 12 companies were added last year including Uber and Lululemon. Typically, the Investment Committee waits ~3 years between when a stock is one of the top 500 and is added to the S&P 500.
So while the S&P 500 is an index, it’s also a series of active decisions.
Why Invest Anywhere Else?
Because large US companies are not the only area of the equity markets. You also have small and mid-size companies, emerging markets, and international stocks. These types of investments help to diversify a portfolio.
When one particular type of investment does so well for a long period, it can be a challenge to branch out and invest in other areas, but it’s important not to put all your eggs in one basket. Simply because something has been doing well doesn’t mean it will continue to do well.
We discuss 5 reasons in this episode you should consider other options for your portfolio:
Significant Difference in 10-Year Returns
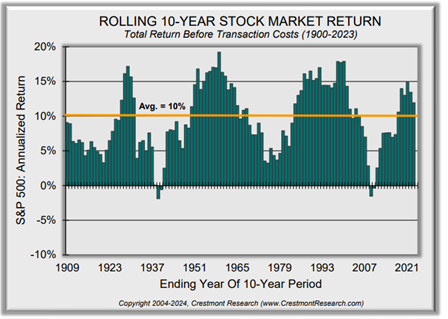
Although recent returns have been very strong, the ending 10-year returns of the S&P 500 can vary widely from ~2% per year to almost 20% per year. On average, the index has returned ~10% per year but results can vary widely as noted in the graph.
Source: https://www.crestmontresearch.com/docs/Stock-Rolling-Components.pdf
It wasn’t that long ago during the late 2000’s when no one wanted to invest in the S&P 500 after a disastrous 10-year stretch as noted in the analysis of the past two decades below.
Negative returns for US vs. 5%-10% per year for various international markets. You’ll know when you have a diversified portfolio because you’ll always own something you don’t like.
It is very difficult to stick to a strategy that returned negative over the last 10 years whereas other areas of the market returned ~10% per year. Easier said than done.
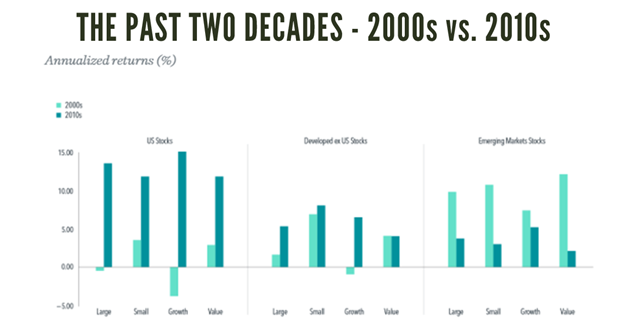
In addition, in the ‘70’s and ‘80’s the international markets outperformed the US markets. Don’t get caught chasing recency bias as currently almost all of the major investment firms expect the international markets to outperform the US over the next ten years according to Morningstar.
Lack of Global Diversification
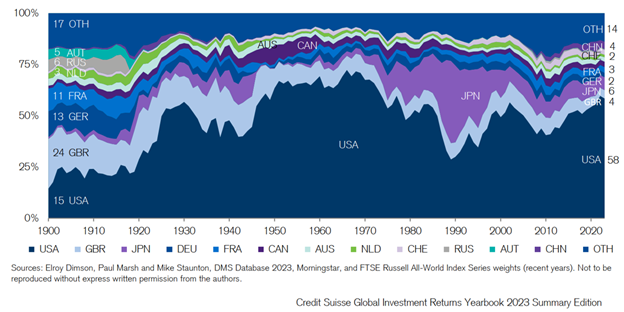
The S&P 500 is all US-domiciled companies that over the last ~40 years have accounted for ~50% of all global stocks. By just owning the S&P 500 you miss out on almost half of the global opportunity set which is another ~10,000 public companies. As Jack Bogle famously said, you don’t want to own the needle, but the haystack.
No one knows where the next Apple or Amazon will come from, but if you own the haystack you’ll have a better chance of benefiting from the Company’s growth as it will impact the global market index. As noted in the graph below the US share of the global equity market has ranged from ~30% to ~70% over the last seventy years. When US’s share declines it typically underperforms the international markets as it did in the 1970’s, 1980’s and 2000’s.
Lower Expected Returns
The S&P 500 is a market cap-weighted index that tends to lean towards large US growth stocks.
Significant research has found that small and value companies outperform large growth stocks over the long term. Therefore, you are overweighting one area of the market which has had lower returns over the long term.
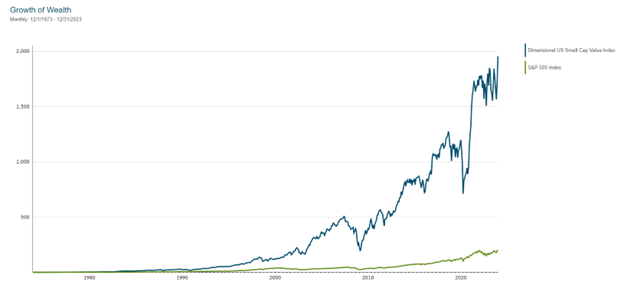
See the graph below for the return difference over the last 50 years.
Source: DFA Returns web and excludes fees and expenses
1973-2023 – small cap value returned 16.34% annualized vs. 11.21% annualized for the S&P 500. Starting with $1 difference in ending net worth of ~$1,750. That doesn’t sound like a lot, but if you invested $100k the 50-year difference is approximately ~$173 million! Why would you avoid the opportunity to invest a portion of your portfolio in areas of the market with higher expected returns?
Risk of Prolonged Underperformance

Does anyone remember the movie Gung Ho of the mid-80’s? It portrayed a takeover of a US car plant by a Japanese corporation. Many thought the Japanese economy was superior to the US at this time. There was a time in the late 80s when the Japanese stock market was worth more than the US stock market. Hard to imagine today.
What happened?
After over 30 years the Japanese stock market finally reached a new high recently as noted in the graph below. 30 years! The longest the US has been negative is ~6 years since 1950. The risk is you put all your money in the S&P 500 and it has a ~20-30-year period of negative performance. How would that impact your retirement?
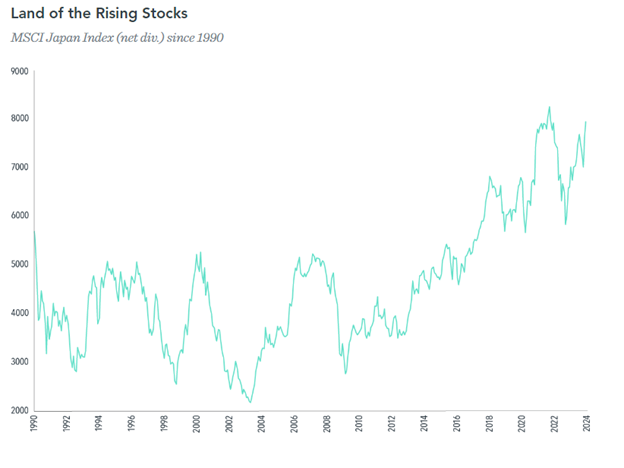
The only way to reduce this risk is through diversification – owning US and International companies.
A recent academic research paper found that the optimal lifetime asset allocation for ending wealth and not running out of money is one with 50% domestic stocks and 50% international stocks. The outcomes were better than 100% US stocks, 100% bills (cash) or a target date fund.
Link to the paper here, but the study looked at returns back to 1890 and included 38 developed countries so much more robust than previous research.
Concentration Risk
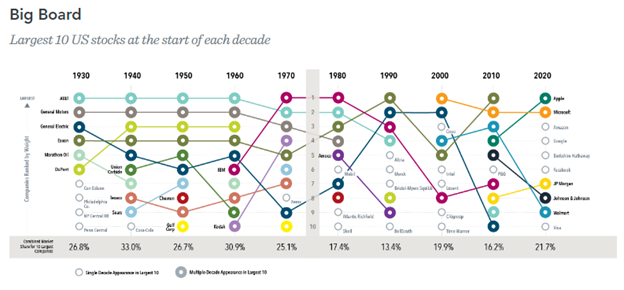
The S&P 500 is more concentrated today than we’ve seen in the last roughly 40 years, with the market value of the Magnificent 7 stocks (Amazon, Apple, Alphabet, Microsoft, etc.). Historically, when this has happened before, like the early 1970’s (Nifty Fifty) and late 1990’s (tech bubble), the S&P 500 future returns have been lower than history.
We included an article here and a chart below highlighting some of these risks of investing in the top ten companies by decade since they change frequently. To this point, charting the performance of stocks following the year they joined the list of the 10 largest firms showed lower returns than the index over the next five and ten years, respectively.
Having a disciplined portfolio gives you the best opportunity to reach your goals. If you’re having trouble choosing the right asset mix for your portfolio, reach out to see how we can help you.
Outline of This Episode
- [0:41] Our article of the week
- [2:14] Is the S&P 500 the only place to invest?
- [3:16] What is the S&P 500?
- [12:00] Higher expected returns with a diversified portfolio
- [17:22] Know your cash flow
Resources & People Mentioned
- Article – A Few Thoughts on Spending Money
- Research Paper – Beyond the Status Quo: A Critical Assessment of Lifecycle Investment Advice
- Capital Group – Risks of bad breadth: Market concentration in 5 charts

