The primary purpose of measuring risk capacity and applying it to an investment strategy is to prevent being forced to sell low. In other words, we want to prevent short term risk from harming your long term security.
In operation, the higher your capacity for risk, the more of your portfolio can be allocated to stocks which offer higher long term return potential but have greater short term volatility than cash and bonds.
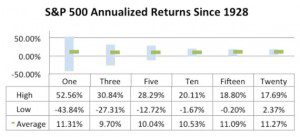
 The chart to the left demonstrates the historic ranges of returns for US Stocks going back to 1928.
As you can see the average one year return is 11.3%, but has been as high as 52.5% and as low as -43.8%.
Then as you look at longer time periods, losses become less likely, and over periods of at least fifteen years there has been only one loss of 0.2%.
Notice that while the difference between the best and worst returns gets narrower as you look at longer time periods, the average returns are close over all time periods.


Bond and Cash returns follow a similar pattern, with the difference between high, low and average returns being lower for bonds, and lowest for cash.
So a sound investment strategy should take into account when you are likely to need money from your portfolio, and allocate the money you won’t need for many years to stocks, while money you will need in the next few years should be in bonds and cash.
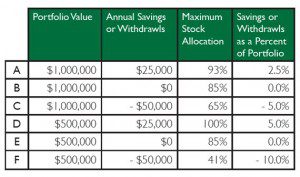
Below are some examples of how our Risk Capacity formula puts this into practice.
The more money you will need each year, the more you should allocate to bonds and cash and this results in a lower stock allocation.
If you are saving money for the next several years, you can allocate more to stocks and less to bonds and cash.
Risk capacity is also dependent on the amount of savings or withdrawals relative to the size of your portfolio as can be seen by the difference in stock allocation for examples C and F.

Example F shows that a maximum of $200,000 of the portfolio would be in stocks, thus allocating $300,000 to bonds and cash which would allow for six years of withdrawals at a $50,000 annual pace.
Example C would allocate $650,000 to stocks and $350,000 to bonds and cash, which would be seven years of withdrawals in bonds and cash.


